
 As part of their series of studies reviewing demographic statistics to estimate prevalence and total population of individuals with Down syndrome, Dr. Brian Skotko and his team of researchers have now delved into the numbers for nine specific states. Based on their analysis, while pregnancies positive for Down syndrome are at an all-time high, the number of babies born has plateaued with the introduction of prenatal testing.
Gert de Graaf, Frank Buckley, Jennifer Dever, and Dr. Brian Skotko published their review of the demographic data in the American Journal of Medical Genetics Part A in the summer of 2017. The team had reviewed all fifty states to determine which had collected the relevant data. While dozens of states collect some data on the incidence of birth defects, live births, pregnancies, and terminations, only nine–Massachusetts, New Jersey, New York, Illinois, Indiana, Michigan, Florida, Kentucky, and Arizona–had sufficient data for them to analyze.
Summary of prior research
In an earlier study looking at the entire United States, the team had estimated that between 2006 and 2010, there was an overall 30% reduction in the numbers of babies born with Down syndrome. “Reduction” meaning that absent prenatal testing and termination, 30% more babies with Down syndrome would have been born. Their analysis accounted for the higher risk of miscarriage for pregnancies positive for Down syndrome.
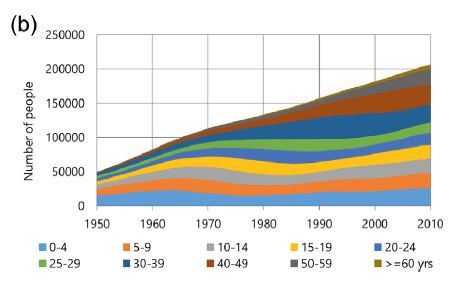
While there was this reduction, between 1950 and 2010 the overall population of people living with Down syndrome had increased from 49,923 to 206,366. This increase is due in large part to medical and societal advances in surgeries, greater inclusion, and support for individuals with Down syndrome extending their average lifespan by more than double the average lifespan in the 1980’s, going from the mid-twenties to now ranging between the 50’s and 60’s.
Review of the nine states
A review of the nine states found that the combined reduction rate was 39%, ranging from 26% in Indiana and Michigan to 52% in New Jersey. Live birth prevalence, i.e. how often a child was born alive with Down syndrome out of all pregnancies, ranged from a low of 1-in-1256 in Kentucky to a high of 1-in-729 in Florida.
New Jersey’s 52% reduction rate was reflected in the estimates for live birth prevalence for 2010. Whereas 121 children were born with Down syndrome in 2010, there were 133 pregnancies estimated to have been positive for Down syndrome which were aborted. In my home state of Kentucky, the numbers were 44 actual live births versus 39 estimated selective terminations for a reduction rate for 2010 of 47%.
Overall, for seven out of the nine states, the population prevalence, i.e. the percentage of individuals with Down syndrome out of the total population for the particular state, increased from 3 per 10,000 in 1950 to between 6.5 and 7.5 per 10,000.
Discussion
There are two different dynamics that the authors cite as explaining this somewhat paradox of a rising and high reduction rate coexisting with a rising and high total population prevalence. The graph at the beginning of this post is illustrative of these two dynamics.
The dynamic to explain the high reduction rate is that average maternal age is increasing, and with it the likelihood that a pregnancy is positive for Down syndrome, as is the utilization of prenatal testing and selective terminations is rising as well. While there are more pregnancies than ever positive for Down syndrome, there has been an increase in selective terminations via identification through prenatal testing to keep the light blue bottom line relatively flat across the decades.
Where the growth has occurred is in the various age cohorts. This is the dynamic to explain the overall rise in prevalence of individuals with Down syndrome as a percentage of the overall population. While the age bands for ages 5-10, 10-14, and 15-19 are similarly relatively stable over the years, the age bands for all ages 20 and up have widened to reflect how more individuals with Down syndrome are living longer lives. As a result, while roughly the same number of individuals with Down syndrome are continuing to be born, those babies are living longer lives, thereby increasing the total population of individuals with Down syndrome.
The authors note that the age range ends years prior to the introduction of cell-free DNA screening and therefore the impact of the newest form of prenatal screening is not reflected in the data.
Massachusetts General Hospital issued a press release regarding the study; it can be accessed at this link.

One thought on “Study estimates population & prevalence of Down syndrome in nine U.S. states”